Problem Set 1
Please render this file to .html and submit via Brightspace.
R Basics
Data types
Create a vector called site_num with the values 1 through 10.
Create a matrix called pop_abund with the values 101 through 120, with 2 columns and 10 rows.
Matrix creation
pop_abund <- matrix(101:120, ncol=2, nrow=10)Create a copy of the dataframe iris (already available as iris) and name it iris_df. View the column names and create a new column called Petal.Area, calculated as Petal.Width times Petal.Length.
Make iris_df
iris_df <- irisView column names (method 1)
names(iris_df)[1] "Sepal.Length" "Sepal.Width" "Petal.Length" "Petal.Width" "Species" View column names (method 2)
str(iris_df)'data.frame': 150 obs. of 5 variables:
$ Sepal.Length: num 5.1 4.9 4.7 4.6 5 5.4 4.6 5 4.4 4.9 ...
$ Sepal.Width : num 3.5 3 3.2 3.1 3.6 3.9 3.4 3.4 2.9 3.1 ...
$ Petal.Length: num 1.4 1.4 1.3 1.5 1.4 1.7 1.4 1.5 1.4 1.5 ...
$ Petal.Width : num 0.2 0.2 0.2 0.2 0.2 0.4 0.3 0.2 0.2 0.1 ...
$ Species : Factor w/ 3 levels "setosa","versicolor",..: 1 1 1 1 1 1 1 1 1 1 ...View column names (method 3)
glimpse(iris_df)Rows: 150
Columns: 5
$ Sepal.Length <dbl> 5.1, 4.9, 4.7, 4.6, 5.0, 5.4, 4.6, 5.0, 4.4, 4.9, 5.4, 4.…
$ Sepal.Width <dbl> 3.5, 3.0, 3.2, 3.1, 3.6, 3.9, 3.4, 3.4, 2.9, 3.1, 3.7, 3.…
$ Petal.Length <dbl> 1.4, 1.4, 1.3, 1.5, 1.4, 1.7, 1.4, 1.5, 1.4, 1.5, 1.5, 1.…
$ Petal.Width <dbl> 0.2, 0.2, 0.2, 0.2, 0.2, 0.4, 0.3, 0.2, 0.2, 0.1, 0.2, 0.…
$ Species <fct> setosa, setosa, setosa, setosa, setosa, setosa, setosa, s…Create a new column (method 1)
iris_df$Petal.Area <- iris_df$Petal.Width * iris_df$Petal.LengthCreate a new column (method 2)
iris_df <- iris_df |>
  mutate(Petal.Area=Petal.Width*Petal.Length)
Data munging
The SmoltWeights sheet from H2SMS_practicalData.xlsx contains the weight in grams (column weight_g) from a sample of 34 wild salmon smolts (column fish_id) during their out-migration from a river to the ocean. Load the dataset and perform basic summaries (range, mean, median, number of missing values for each column). Identify (using code) which fish are missing values for weight_g.
Load and check data
tibble [34 × 2] (S3: tbl_df/tbl/data.frame)
 $ fish_id : num [1:34] 1 2 3 4 5 6 7 8 9 10 ...
 $ weight_g: num [1:34] 44.2 40.2 39.7 36 40.9 33.8 51.2 41.1 36.7 37.2 ...
Load and check data
summary(smolt_df) fish_id weight_g
Min. : 1.00 Min. :26.60
1st Qu.: 9.25 1st Qu.:36.00
Median :17.50 Median :39.70
Mean :17.50 Mean :40.17
3rd Qu.:25.75 3rd Qu.:46.10
Max. :34.00 Max. :51.20
NA's :1 There are many ways to identify the row with missing data.
Method 2: Extract the row from the data.frame
smolt_df[is.na(smolt_df$weight_g),] # gives the row from the data.frame# A tibble: 1 × 2
fish_id weight_g
<dbl> <dbl>
1 12 NACreate a new column called weight_lb that gives the weights in pounds, where 1 kg = 2.205 lb.
Calculate new column
smolt_df$weight_lb <- smolt_df$weight_g / 1000 * 2.205What proportion of fish weigh less than 0.2 lb? How many fish is this?
Create a new data.frame called large_df that contains only the fish as large or larger than the median weight and excludes rows with missing weights.
# A tibble: 17 × 3
   fish_id weight_g weight_lb
     <dbl>    <dbl>     <dbl>
 1       1     44.2    0.0975
 2       2     40.2    0.0886
 3       3     39.7    0.0875
 4       5     40.9    0.0902
 5       7     51.2    0.113
 6       8     41.1    0.0906
 7      17     46.7    0.103
 8      20     46.1    0.102
 9      21     50.9    0.112
10      22     45.7    0.101
11      23     46.8    0.103
12      24     50.5    0.111
13      25     46.7    0.103
14      29     41.8    0.0922
15      32     41.5    0.0915
16      33     47.3    0.104
17 34 48.9 0.108 Create a new data.frame called extreme_df that contains only fish more than 1.5 standard deviations greater than the mean and excludes rows with missing weights.
# A tibble: 3 × 3
  fish_id weight_g weight_lb
    <dbl>    <dbl>     <dbl>
1       7     51.2     0.113
2      21     50.9     0.112
3 24 50.5 0.111Plotting
Histograms
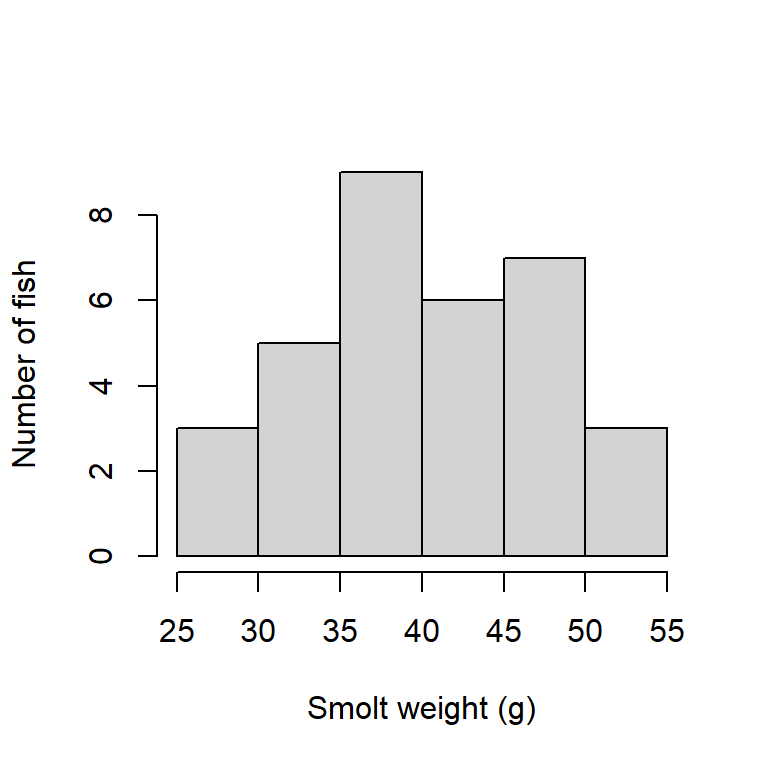
Create a histogram of the smolt weights, labelling the axes and omitting a plot title. Add a figure legend using #| fig-cap: "..." in the quarto document code block. Add #| label: fig-smoltHist, and then in text below, reference the figure by typing @fig-smoltHist.
When rendered, @fig-smoltHist in the text is automatically replaced by “Figure 1”, with figure numbers updated automatically. Adding a legend with #| fig-cap: "..." in your code block will automatically give that figure a number, making your life easier.
The label must start with fig- for this to work.
Note that you cannot re-use the same label.
Here is some text referencing Figure 1 by using the label I’ve used in the code chunk (@fig-smoltHist).
Code chunk
```{r}
#| code-fold: true
#| code-summary: "Code chunk"
#| label: fig-smoltHist
#| fig-cap: "Histogram of smolt weights."
#| fig-width: 4
#| fig-height: 4

hist(smolt_df$weight_g,
     main=NULL,
     xlab="Smolt weight (g)",
     ylab="Number of fish")
```
Line plots
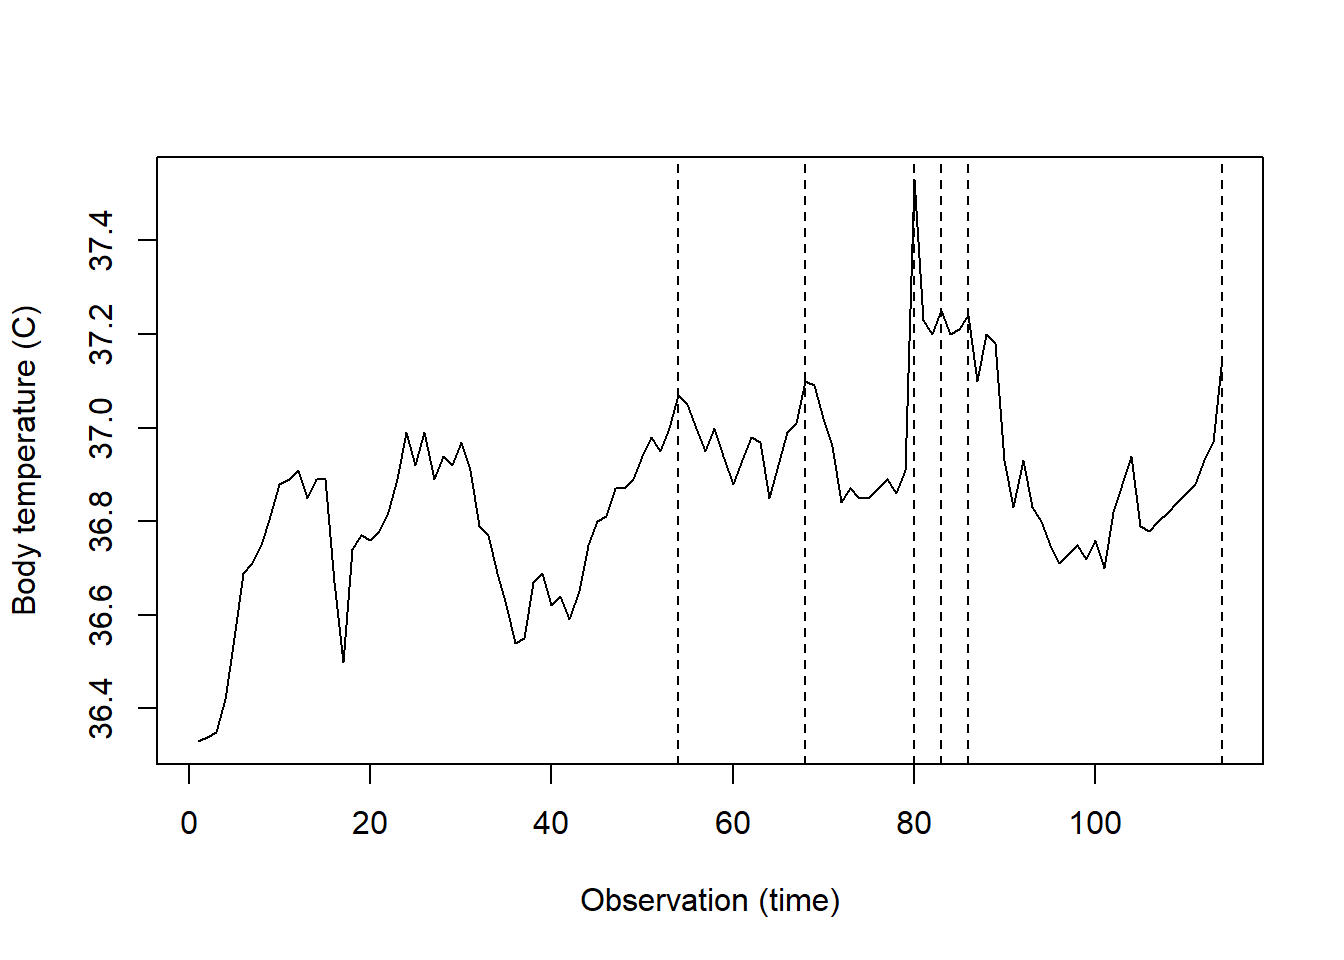
The dataset beaver1 is available in R, giving the body temperature through time of a female beaver (Castor canadensis), with observations every 10 minutes.
str(beaver1)'data.frame': 114 obs. of 4 variables:
$ day : num 346 346 346 346 346 346 346 346 346 346 ...
$ time : num 840 850 900 910 920 930 940 950 1000 1010 ...
$ temp : num 36.3 36.3 36.4 36.4 36.5 ...
$ activ: num 0 0 0 0 0 0 0 0 0 0 ...Debug the following code so that it produces a line plot of body temperature by observation id. Note that time is given in the form 0330 for 3:30am (?beaver1). The obs_id column thus gives the ordered observations from first to last.
As an added challenge, add vertical dashed lines indicating when the beaver was active.
Set #| eval: true to run the code when you click Render. If you’ve successfully debugged, you should then see your plot.
Original:
Corrected:
Boxplots
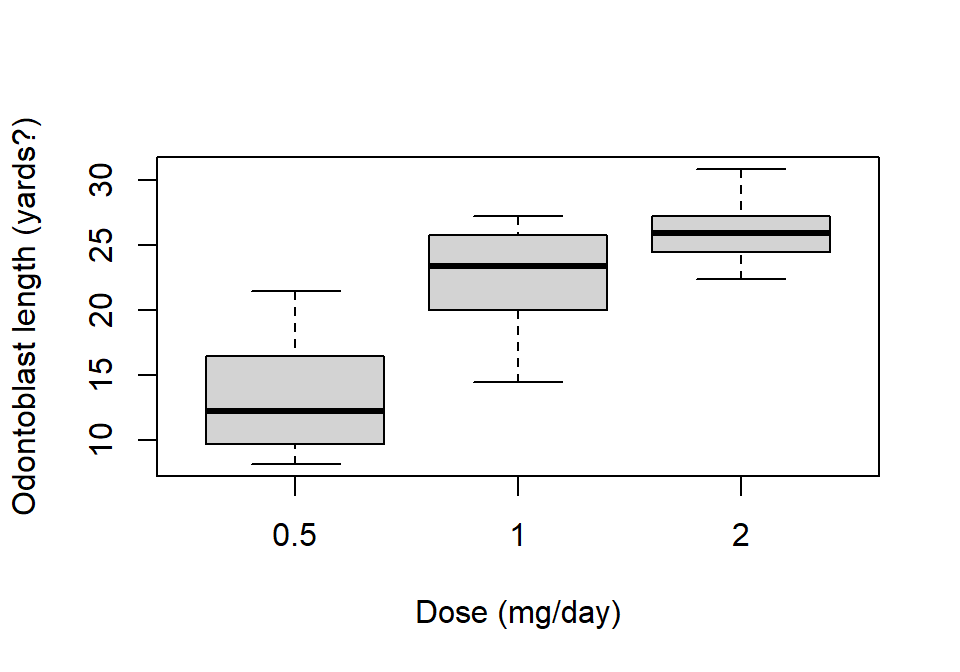
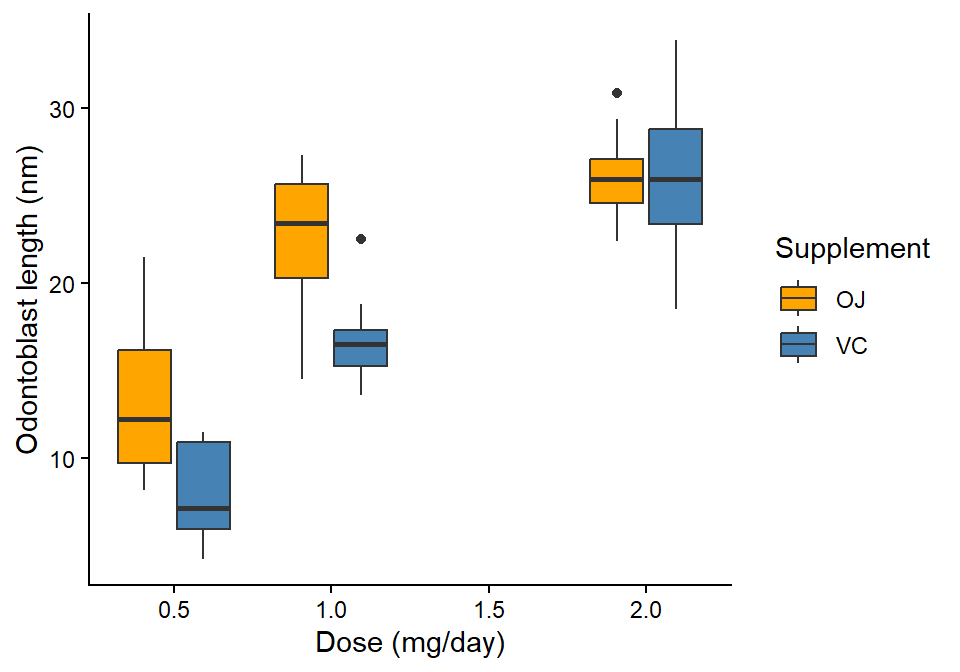
The dataset ToothGrowth is available in R, giving the length (len) of tooth-growth cells (odontoblasts) in 60 guinea pigs under different vitamin C regimes (supp: OJ=orange juice, VC=ascorbic acid; dose: 0.5, 1, 2 mg/day). Create a boxplot of the length by dose for only the guinea pigs receiving orange juice. Write a figure caption and add a label as above.
Using base R
```{r}
#| code-fold: true
#| code-summary: "Using base R"
#| label: fig-OJ_lenByDose
#| fig-cap: "Odontoblast length by dosage in guinea pigs receiving orange juice."
#| fig-width: 5
#| fig-height: 3.5

boxplot(len ~ dose, data=ToothGrowth[ToothGrowth$supp=="OJ",],
        xlab="Dose (mg/day)",
        ylab="Odontoblast length (yards?)")
```
Use ggplot() to make the same boxplot, but with supp as the fill colour.
Remember to check the column types first!
Check data.frame structure
str(ToothGrowth)'data.frame': 60 obs. of 3 variables:
$ len : num 4.2 11.5 7.3 5.8 6.4 10 11.2 11.2 5.2 7 ...
$ supp: Factor w/ 2 levels "OJ","VC": 2 2 2 2 2 2 2 2 2 2 ...
$ dose: num 0.5 0.5 0.5 0.5 0.5 0.5 0.5 0.5 0.5 0.5 ...Since dose is numeric, there are two options to produce different boxes for each combination of dose and supp.
Method 1: Coerce dose to a factor
ggplot(ToothGrowth, aes(factor(dose), len, fill=supp)) +
  geom_boxplot() +
  scale_fill_manual("Supplement", values=c("orange", "steelblue")) +
  labs(x="Dose (mg/day)",
       y="Odontoblast length (nm)")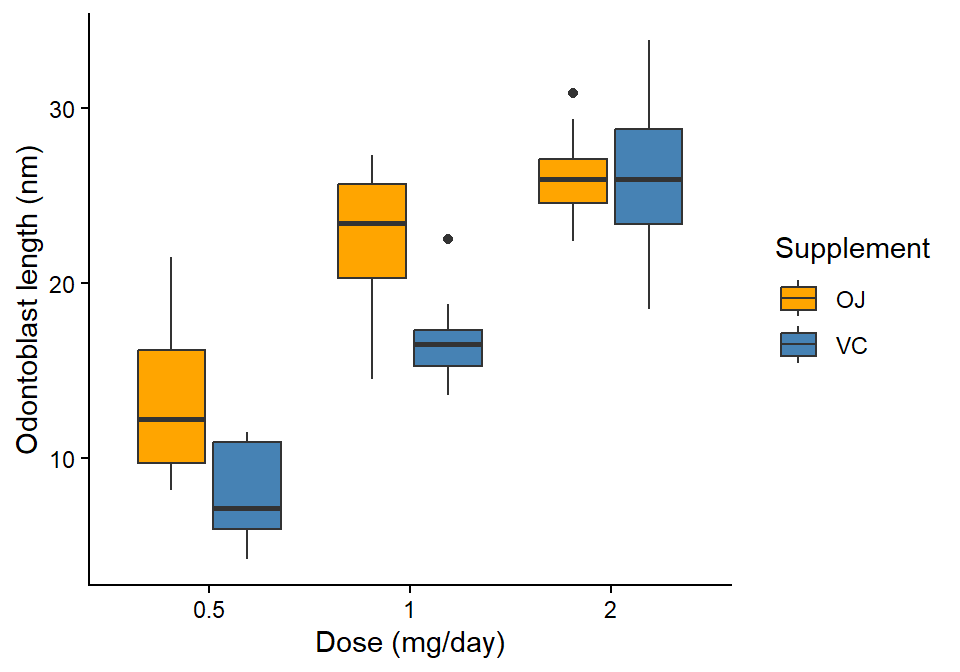
Method 2: Specify group=
```{r}
#| code-fold: true
#| code-summary: "Method 2: Specify `group=`"
#| label: fig-lenByDose_gg2
#| fig-cap: "Odontoblast length by dosage and supplement type in guinea pigs."
#| fig-width: 5
#| fig-height: 3.5

ggplot(ToothGrowth, aes(dose, len, fill=supp, group=paste(dose, supp))) +
  geom_boxplot() +
  scale_fill_manual("Supplement", values=c("orange", "steelblue")) +
  labs(x="Dose (mg/day)",
       y="Odontoblast length (nm)")
```
Scatter plots
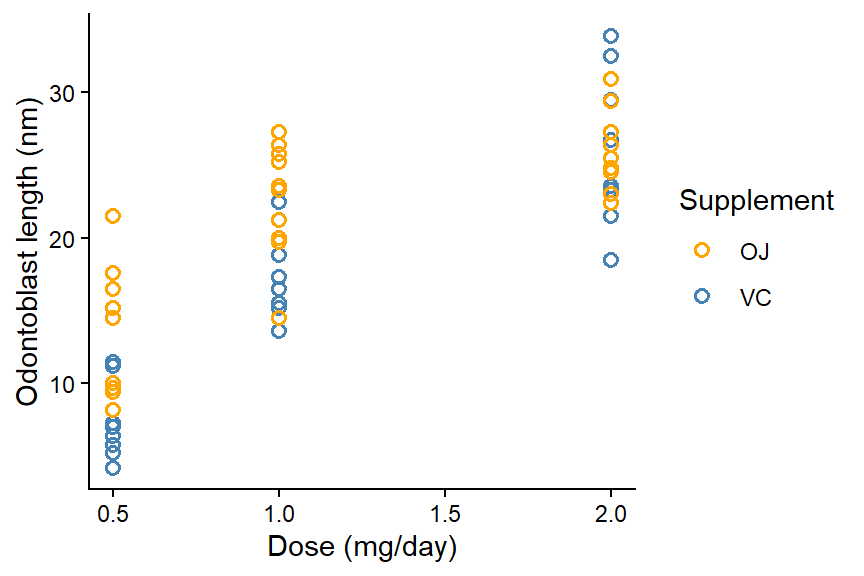
Using the same ToothGrowth dataset, produce a scatter plot of odontoblast length as a function of dose, where supp is the point colour.
Since supp is a factor, the levels can be coded into colours automatically in plot().
Using base R
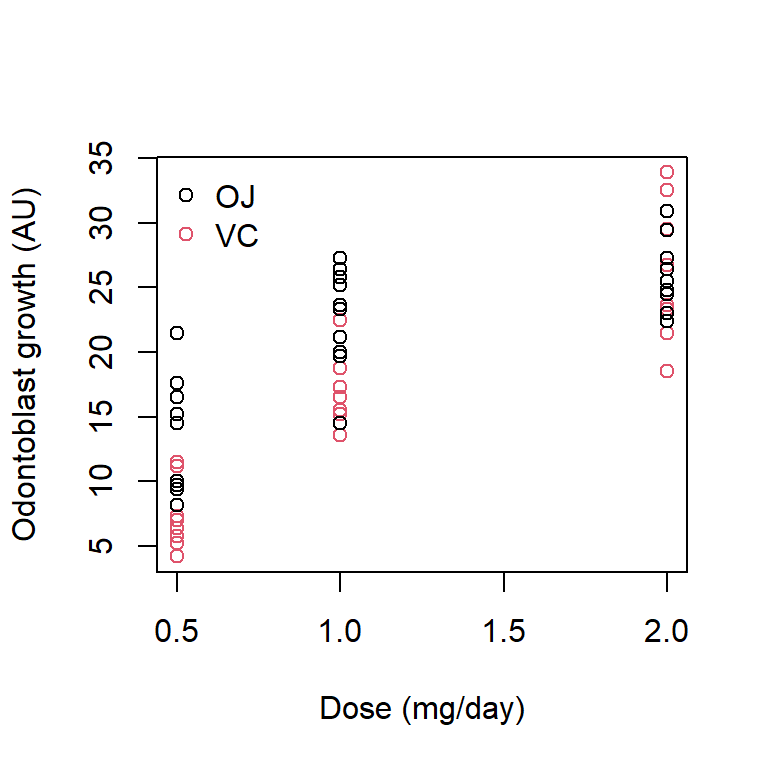
In my opinion, it is easier to use ggplot as your figures get more complex.
Using ggplot
ggplot(ToothGrowth, aes(dose, len, colour=supp)) +
  geom_point(shape=1, size=2, stroke=0.8) +
  scale_colour_manual("Supplement", values=c("orange", "steelblue")) +
  labs(x="Dose (mg/day)",
       y="Odontoblast length (nm)") +
  theme_classic()